To measure SEO when clicks drop, start with leads and sales from organic search. Then read clicks, impressions, and position as leading indicators, and track how often AI answers mention you next to them.
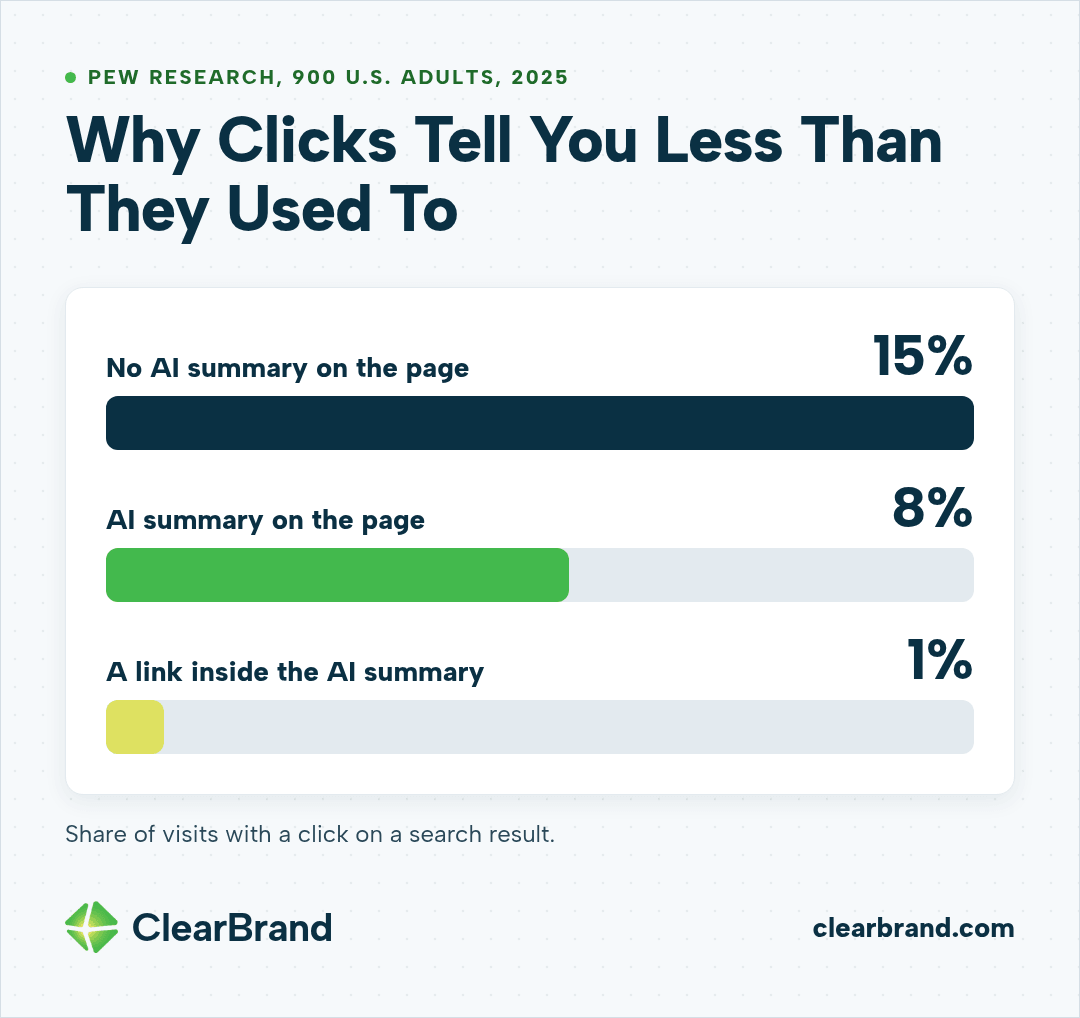
Many site owners have watched clicks fall as Google answers more searches on the results page. When Pew Research tracked the browsing of 900 U.S. adults in 2025, people clicked a regular search result in 8% of visits that showed an AI summary, compared with 15% when there was none.
We still judge every client program the same way: did search bring in leads and revenue? We measure that month by month, and we read a week that looks bad the same way.
Why clicks tell you less than they used to
Clicks used to be a decent stand-in for results. More searches got a click, and more clicks usually meant more leads.
AI Overviews changed that. In that 2025 Pew Research study, people clicked a link inside the AI summary itself in only 1% of visits.
Search Console didn’t add a separate line for AI answers. Google counts AI Overview and AI Mode traffic inside the normal Performance report under the “Web” search type, according to its guidance on AI features and your website. An AI Overview takes up one position on the page, and every link inside it gets that same position.
Impressions also count more than most people expect. Google’s definition of an impression is a link that someone saw or could have seen on the results page, whether or not they scrolled to it.
Google also says the clicks that do come from pages with AI Overviews are higher quality, meaning people tend to spend more time on the site. Fewer clicks can still bring in the same number of buyers.
What we measure first: leads and sales
For every client, we measure leads and revenue first. Traffic and clicks are in every report, but a client hires us to grow the business, so the conversation always comes back to money.
What counts as a lead depends on the business:
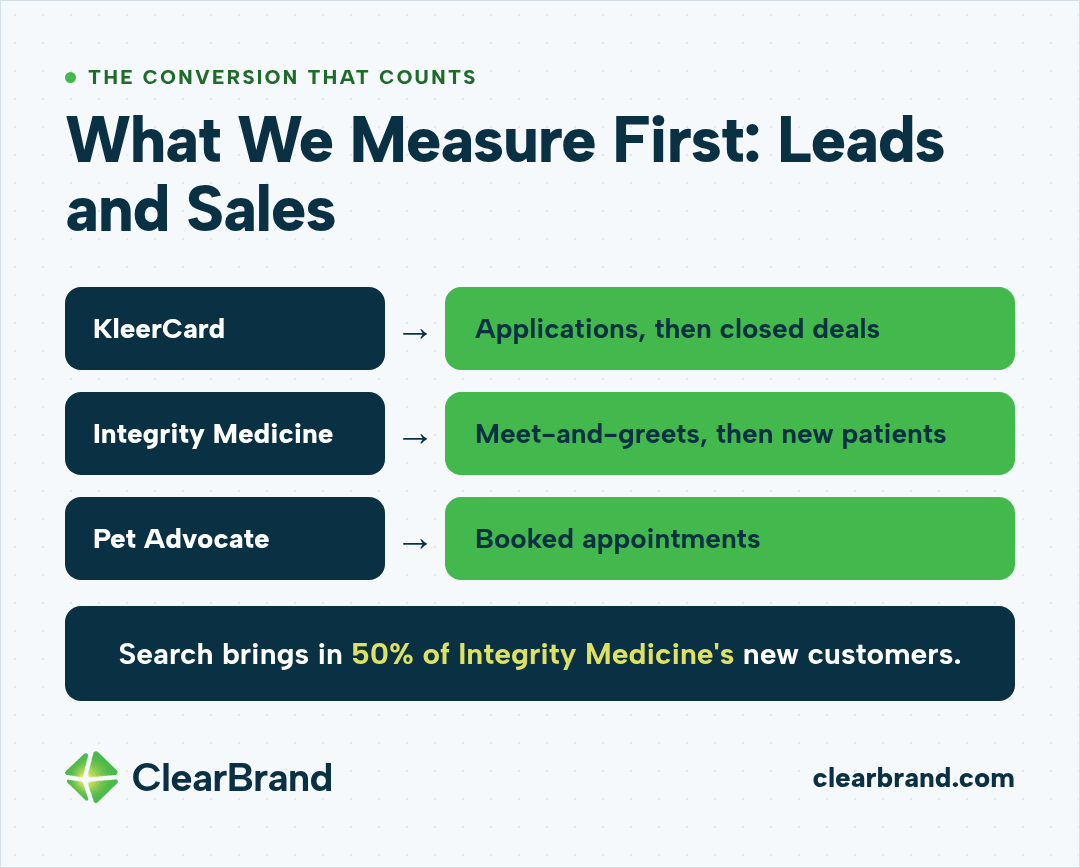
- KleerCard, a fintech that issues cards for churches and nonprofits: applications, then closed deals.
- Integrity Medicine, a direct primary care practice: free meet-and-greets, then new patients.
- Pet Advocate, a low-cost spay, neuter, and dental clinic for pets: booked appointments for dental cleanings and spay and neuter surgeries.
Integrity Medicine shows why we start there. Search brings in 50% of its new customers, and we know that because the practice counts the new patients added to each doctor’s panel every month and where they came from.
Before we start, we agree with the client on the one conversion that counts. Then we make sure it’s tracked, usually as a key event in Google Analytics so organic leads can be separated from everything else.
What working looks like in month 3 vs month 9
SEO pays off over months, so we set different expectations at different points in the program.
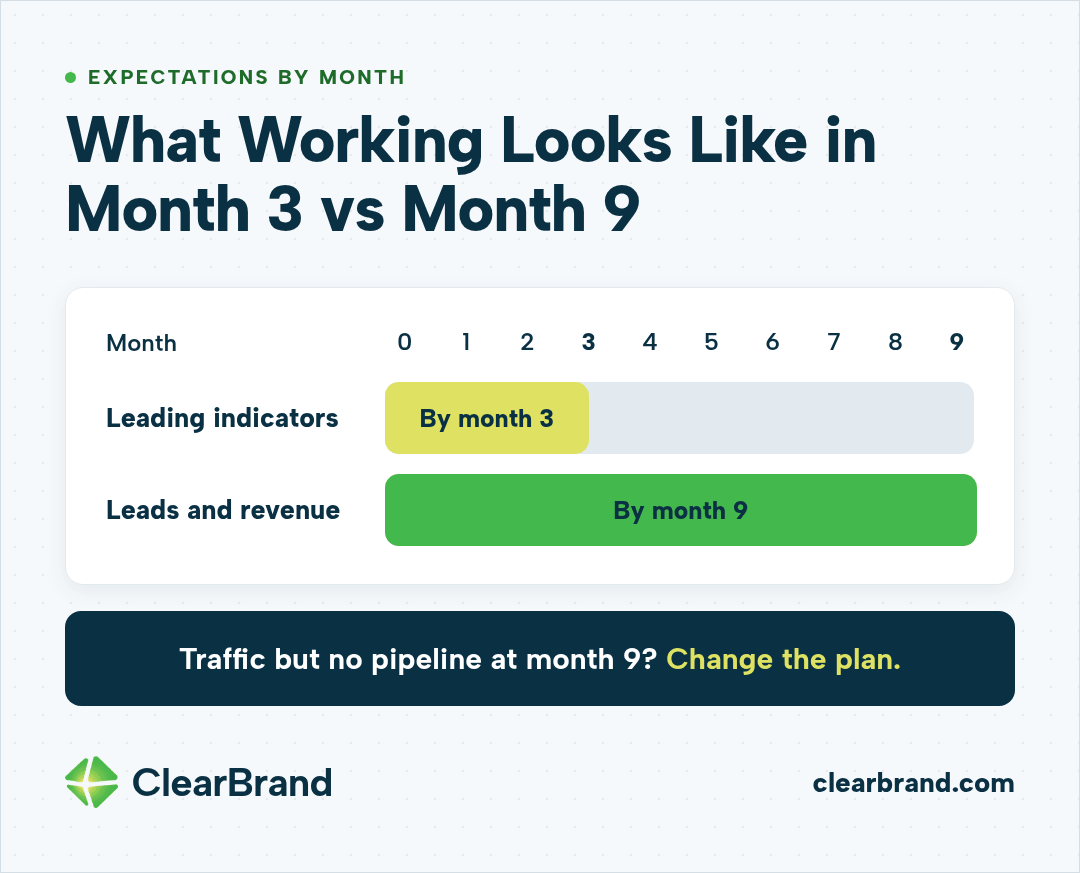
By month 3, we’re looking for leading indicators. Impressions, clicks, and positions should be rising for the pages we’ve built or fixed, and we hope to see the first leads from search.
By month 9, the work should be turning into revenue. For a SaaS company, that means trials, demos, and growth in recurring revenue that we can trace back to organic search.
If month 9 brings traffic but no new pipeline, something in the plan needs to change, usually which searches and pages we’re focused on.
How we read a week where impressions rise and clicks fall
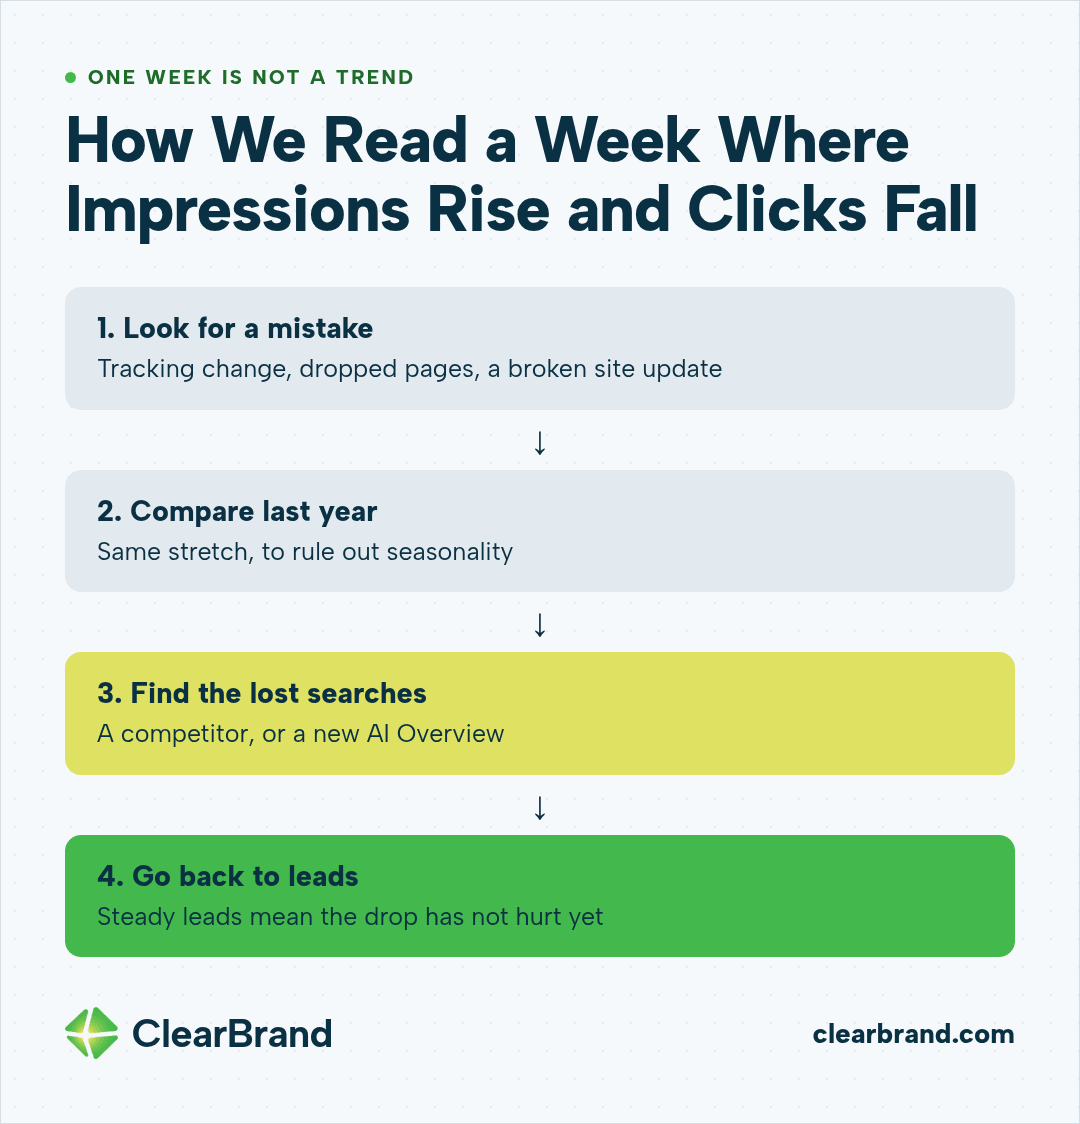
One week isn’t a trend. When a week drops, we look for a mistake first: a tracking change, pages that fell out of Google’s index, or a site update that broke something. Search Console’s page indexing report and a record of recent site changes usually answer that question.
Some drops are seasonal, so we compare the week against the same stretch last year before reading anything into it.
If clicks fall for months while impressions keep rising, we compare date ranges in the Performance report to find which searches lost the clicks, then run those searches ourselves to see what the results page looks like now. 2 causes come up most often:
- A competitor published something that now wins the click for that search.
- Google started showing an AI Overview on a search that didn’t have one before.
Then we go back to leads. If leads are steady or rising while clicks fall, the drop hasn’t hurt the business yet. We still work on getting those clicks back, and the conversation stays on leads.
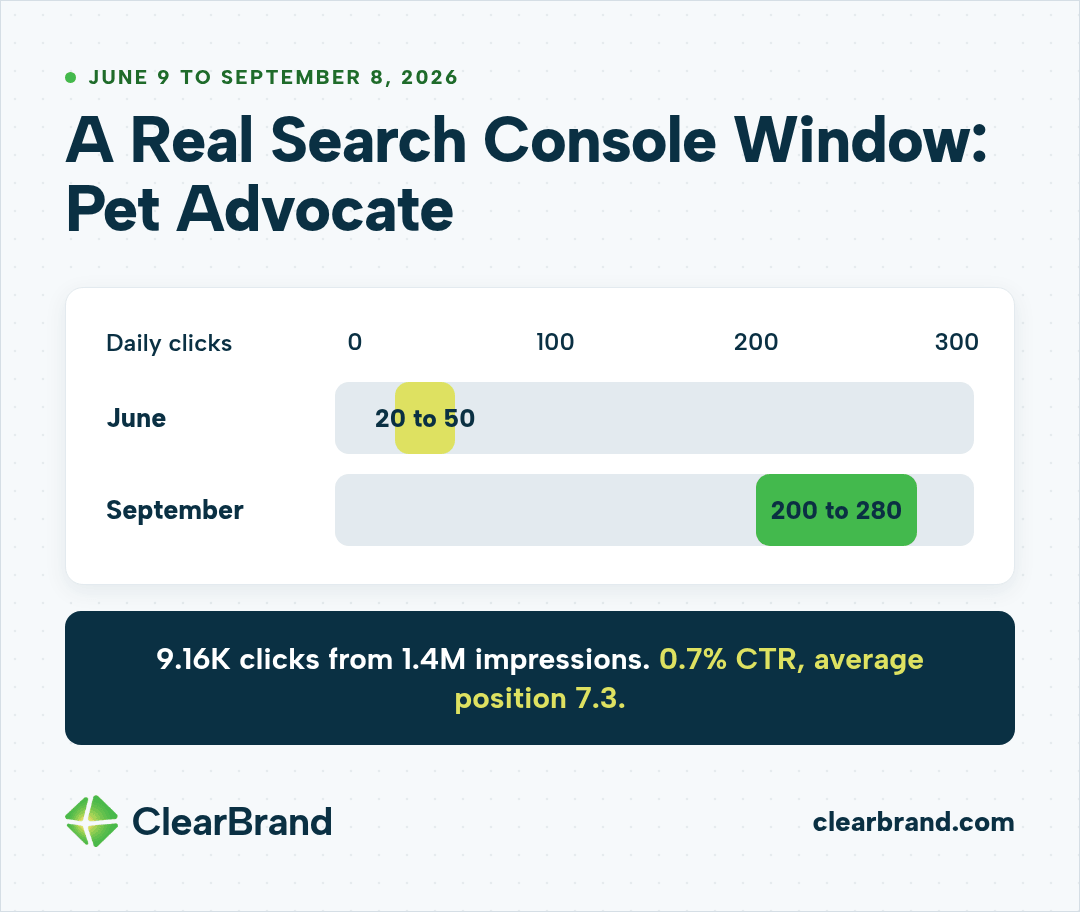
A real Search Console window: Pet Advocate
Pet Advocate’s Google Search Console data shows what 90 days of growth can look like. From June 9 to September 8, 2026, the site earned 9.16K clicks from 1.4M impressions, a 0.7% click-through rate, at an average position of 7.3.
Daily clicks went from about 20 to 50 in June to about 200 to 280 by September.
A 0.7% click-through rate can look weak on its own. In this case impressions grew faster than clicks because the site started showing up for far more searches, many of them below the top 5 results. If those pages move up, clicks usually rise with them.
The number Pet Advocate cares about is booked appointments. Search Console can show that more people are finding the site, but whether those visits turn into appointments shows up in the clinic’s booking system.
Count the buyers who find you in an AI answer first
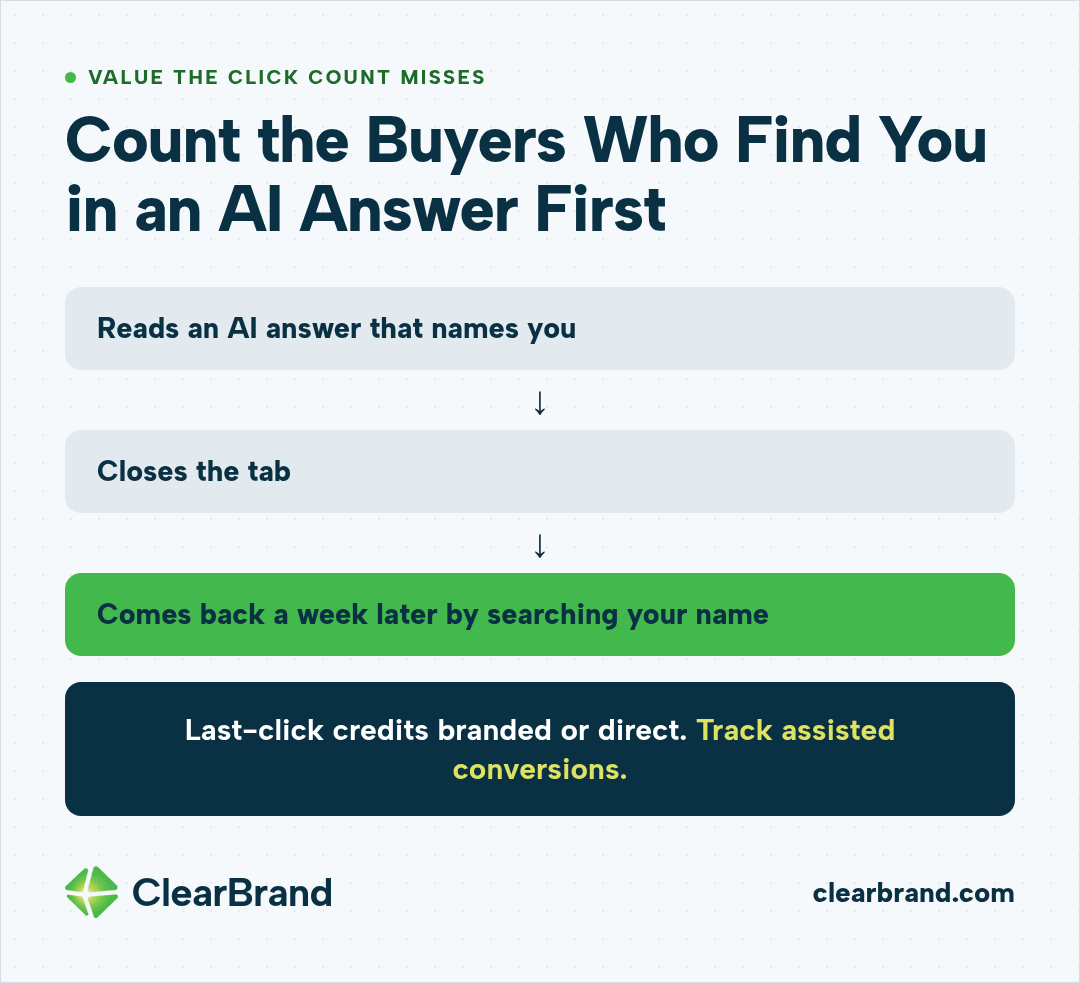
Some of the value of search never shows up as an organic click. A buyer reads an AI answer that names you, closes the tab, and comes back a week later by typing your company name into Google.
Last-click reports credit that lead to branded search or direct traffic. To catch it, we track assisted conversions and watch branded search impressions in Search Console alongside the AI visibility tracker. When AI answers mention a client more often and branded searches rise with them, search is doing work that the organic click count misses.
What goes on our client dashboards
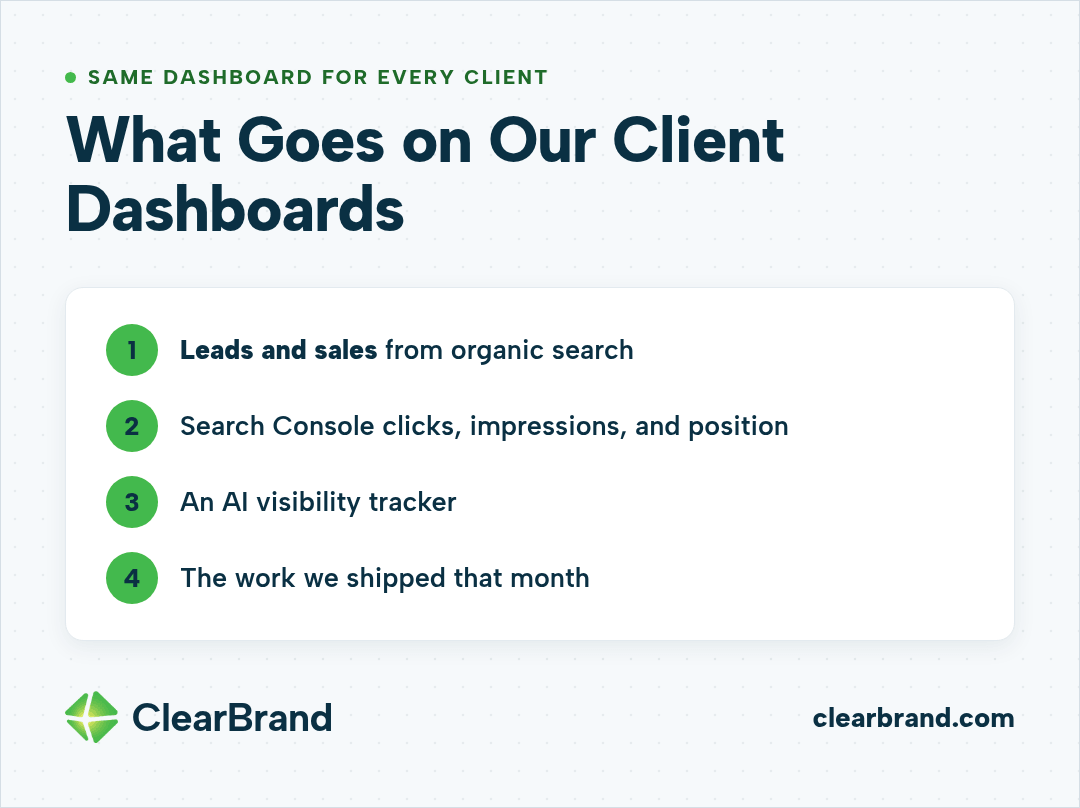
Every client gets the same dashboard, built around leads and revenue:
- Leads and sales from organic search
- Search Console clicks, impressions, and average position
- An AI visibility tracker that updates on its own and shows when AI answers mention the client
- The work we shipped that month
The dashboard leads with leads and sales. Rankings appear as supporting context, because a ranking changes with the searcher’s location and history, which Google’s own Search Console help points out. AI visibility sits on the same dashboard. The dashboard is part of every SEO retainer, alongside the content and technical work.
How to set this up on your own site
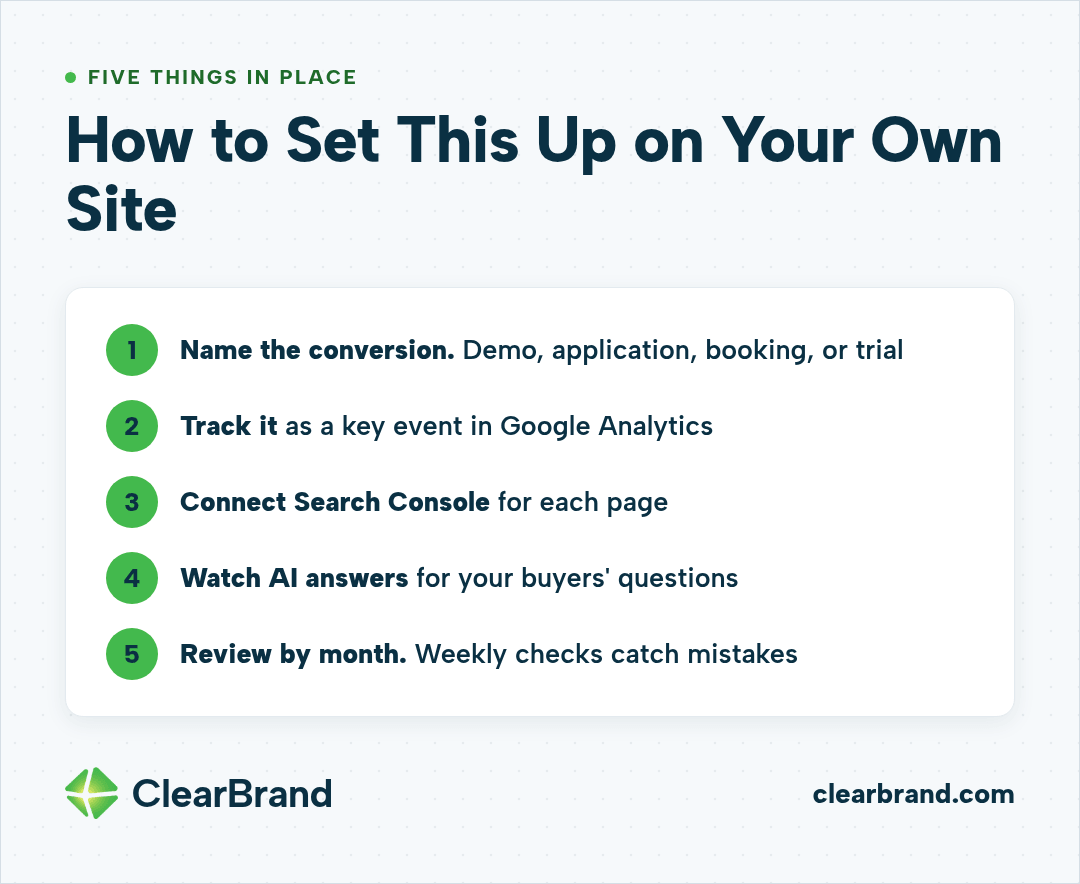
You don’t need an agency to measure SEO this way. You need 5 things in place:
- Name the conversion. Pick the action that turns into revenue: a demo request, an application, a booking, or a trial.
- Track it. Mark that action as a key event in Google Analytics so you can see how many came from organic search.
- Connect Search Console. Use the Performance report for clicks, impressions, and position on each page.
- Watch AI answers. Ask ChatGPT, Perplexity, and Google’s AI Mode the questions your buyers ask, and note whether you’re cited. Our explainer on Answer Engine Optimization covers why that matters.
- Review by month. Look at leads and Search Console trends once a month. Weekly checks are for catching mistakes.
Frequently asked questions
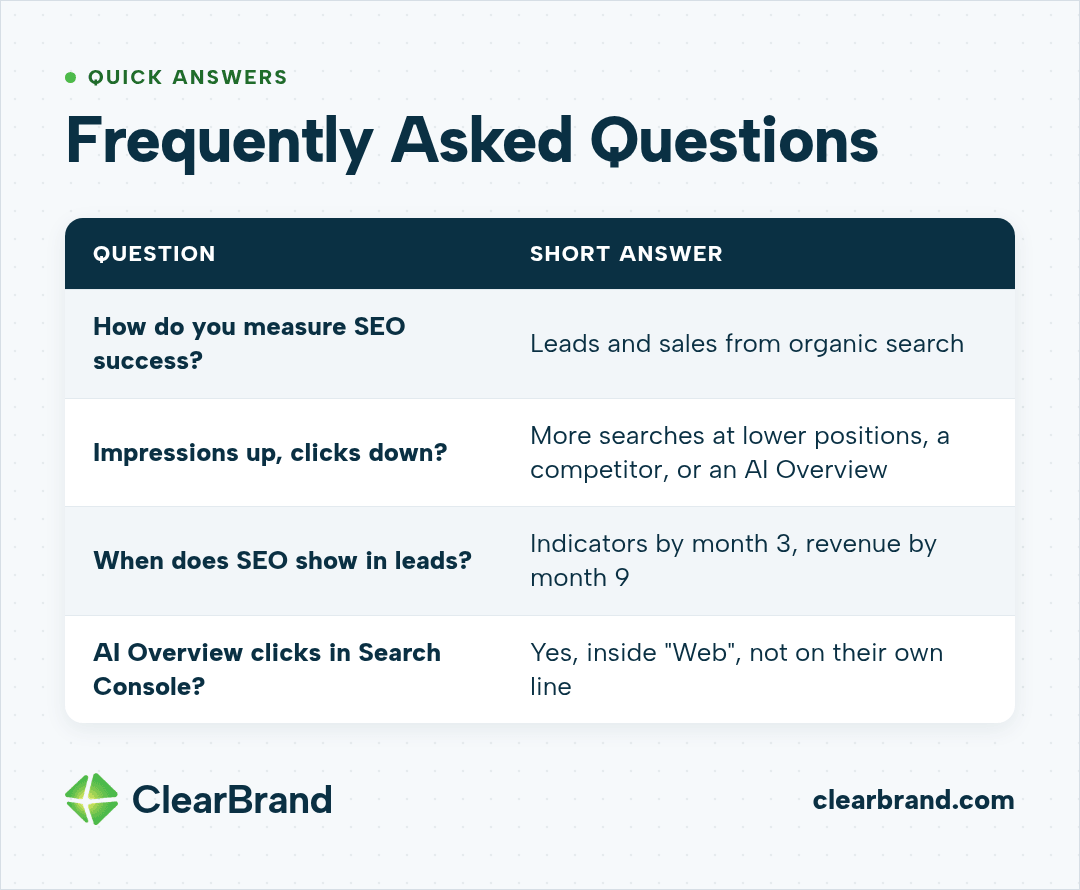
How do you measure SEO success?
Measure SEO success by the leads and sales that come from organic search. Use clicks, impressions, and position as early signals, especially in the first 3 months, and track whether AI answers cite your site.
Why are my impressions up but clicks down?
Impressions can rise while clicks fall when your pages show up for more searches at lower positions, when a competitor starts winning the click, or when Google adds an AI Overview to a search. Check a few months of data, not one week, and compare it with your leads.
How long before SEO shows up in leads?
We look for leading indicators like rising impressions and clicks by month 3, and for leads and revenue by month 9. The timeline depends on your site’s starting point and your competition.
Do AI Overview clicks show up in Search Console?
Google includes AI Overview and AI Mode traffic in the Search Console Performance report under the “Web” search type. It doesn’t break that traffic out on its own line.
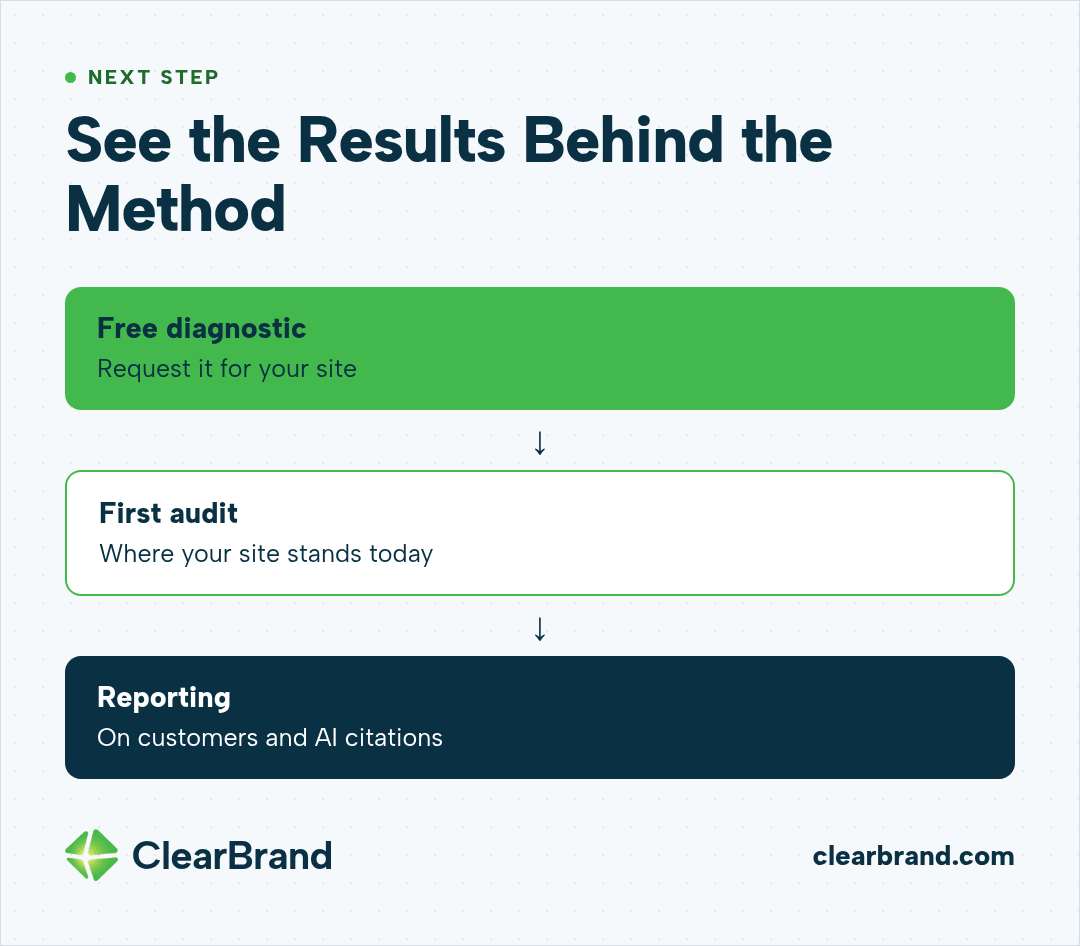
See the results behind the method
Request a free diagnostic and we’ll show you how it would look for your site, from the first audit to reporting on customers and AI citations. You can also see it in practice on our client results page, or read how we run SEO.