

The median B2B SaaS company spent 8% of annual recurring revenue on marketing in 2025. This answers the question many founders ask: how much should a SaaS company spend on marketing?
SaaS Capital’s 2025 survey of over 1,000 private companies shows this number unchanged from the prior year. The all-industry CMO average sits at 7.7% according toGartner’s 2025 CMO Spend Survey.
At ClearBrand we work with SaaS companies, and we have analyzed these benchmarks against client results to give you numbers you can use.
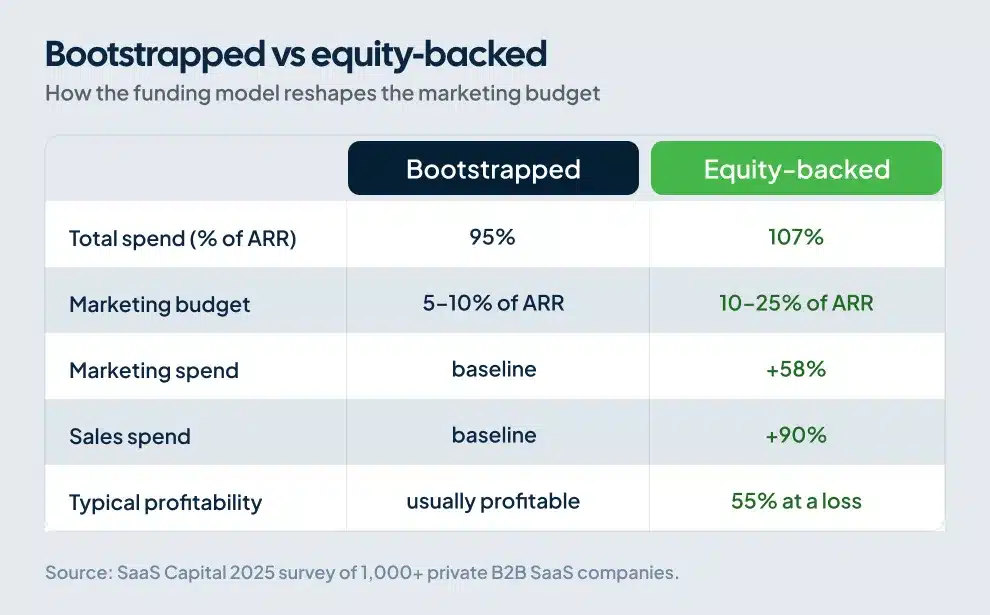
But the median hides a wide range. A bootstrapped company at $5M ARR running marketing at 5% spends nothing like a Series B company burning 40% to fuel growth. Equity-backed SaaS companies spend 58% more on marketing than their bootstrapped peers.
This guide gives you the benchmarks, the math to back-solve your own number, and the channel allocation framework. You can build a saas marketing budget that fits your stage, funding, and growth target.
What the average SaaS marketing budget looks like in 2026
The headline benchmarks
Gartner’s 2025 CMO Spend Survey puts the all-industry marketing budget at 7.7% of revenue, flat year over year. The IT and business services subsegment dropped sharply to 5.8% in 2025 from 9.0% the year before.
SaaS Capital’s 2025 survey of more than 1,000 private B2B SaaS companies shows a median 8% of ARR spent on marketing. Selling costs sit at a separate 13% line item, up from 10.5% the prior year. Equity-backed companies spend 58% more on marketing and 90% more on sales than bootstrapped peers.
The IT and business services drop signals tighter unit economics expectations from boards. Capital efficiency shapes how 2026 budgets get reviewed.
Why the IT/business services drop matters
Tech-services-and-products companies with over $250M revenue landed at 7.1% in 2025, down from 7.3% in 2024. The broader category fell further. Boards are not lowering marketing because returns weakened. They are demanding proof that every dollar generates measurable new ARR.
How to size your SaaS marketing budget by stage
Stage changes everything. The right percentage depends on where you sit today and where you want to be in 12 months.
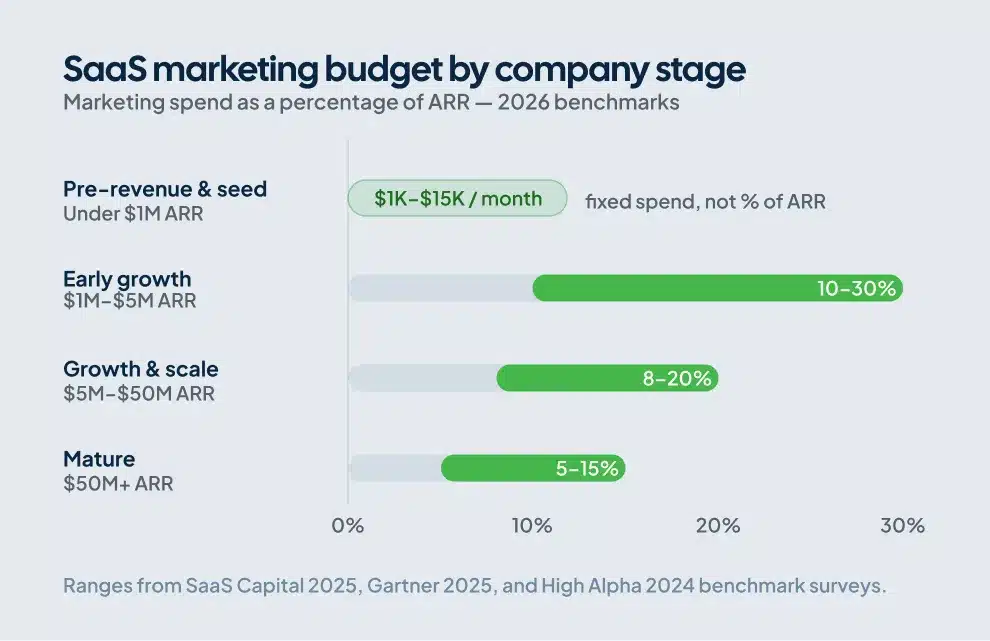
Pre-revenue and seed (<$1M ARR)
Marketing spend at this stage is a fixed dollar figure, not a percentage. Bootstrapped companies typically run $1,000 to $5,000 per month. Funded companies run $5,000 to $15,000 per month. Founder time carries most of the load through organic content, community presence on Reddit and Indie Hackers, and manual outbound.
High Alpha’s 2024 SaaS Benchmarks Report shows companies under $1M ARR allocating a median 27% of ARR to combined sales and marketing. The number looks high because ARR is still small.
Early growth ($1M–$5M ARR)
Typical range: 10–30% of ARR. The higher end appears when funding pushes aggressive growth. The lower end reflects bootstrapped discipline.
A common breakdown looks like this:
-
45–55% to people (in-house team plus contractors)
-
15–20% to paid media and demand gen
-
15–25% to content, SEO, and AEO
-
4–6% to martech
-
5–10% to events, community, and partnerships
Benchmarkit 2025 and High Alpha 2024 data both show $1M–$5M ARR companies spending a median 35% of ARR on combined S&M when they target fast growth.
If you are building a high-converting website at this stage, that investment compounds across every other channel. We see this with many early-stage clients.
Growth and scale ($5M–$50M ARR)
Typical range: 8–20% of ARR. Equity-backed companies often hit 47% of revenue allocated to combined sales and marketing. PE-backed peers run closer to 33%. Retention and expansion marketing grows from under 5% of the budget at early stage to 15–25% at this scale.
Mature ($50M+ ARR)
Typical range: 5–15% of ARR. Public benchmark: Salesforce spent roughly 37% of $34.9B revenue on combined sales and marketing in its most recent fiscal year. Brand and category-defining investments take a larger share. CAC pressure stays constant even at this size.
The math: how to back-solve a marketing budget from CAC and LTV
Most articles stop at the 8% median. You need the math that lets you defend a specific number to a CEO or board.
The core formula
CAC (Customer Acquisition Cost) equals total sales and marketing spend in a period divided by new customers acquired in that period.
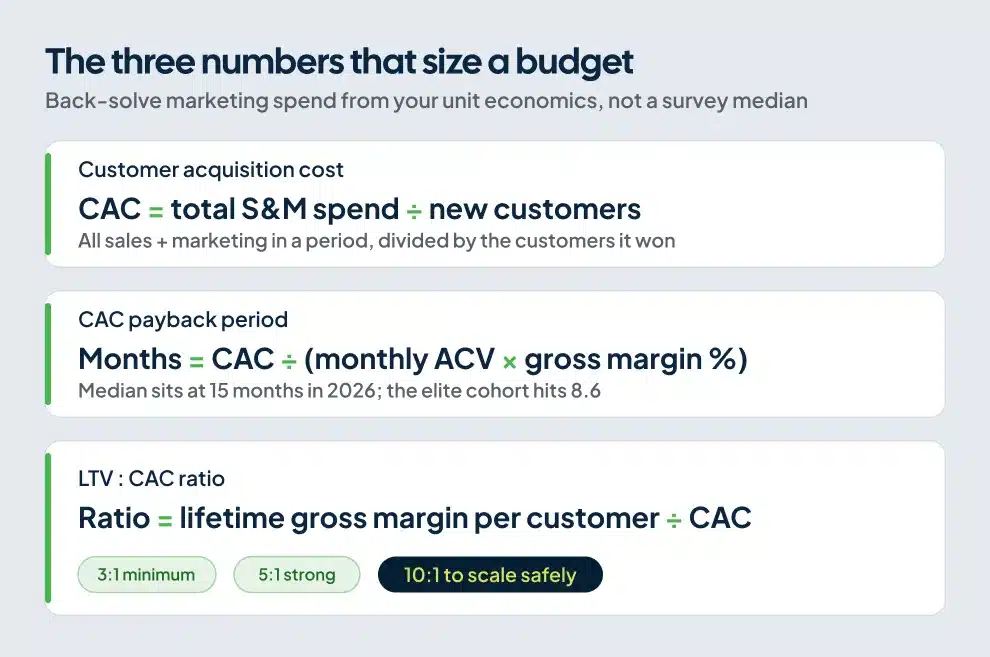
CAC payback in months equals CAC divided by (monthly ACV × gross margin percent).
LTV:CAC ratio equals lifetime gross margin per customer divided by CAC. Target 3:1 minimum, 5:1 strong.
LTV:CAC ratio gets worse as you scale marketing spend. So, if you are prepping to scale it, you want to aim for 10:1 or better so you know you have room for LTV:CAC to get worse and still hit your targets as your spend increases.
These three numbers together tell you whether your current spend is appropriate.
A worked example
Take a B2B SaaS at $5M ARR, $2K ACV (Annual Contract Value), 80% gross margin, and 5% annual churn.
LTV equals $2,000 × 0.80 / 0.05 = $32,000 lifetime gross margin per customer.
For a 3:1 LTV:CAC ratio, CAC must stay below $10,667. For a 5:1 ratio, CAC must stay below $6,400. For a 10:1 ratio, CAC must stay below $3,200.
If the company acquires 250 new customers per year, allowable combined sales and marketing spend lands between $1.6M and $2.66M. That equals 32% to 53% of ARR for combined S&M, which lines up with growth-stage benchmarks.
We have run this math with clients. Those who anchor on payback instead of arbitrary percentages tend to make clearer decisions.
What’s changed in 2026
B2B SaaS CAC is up 40–60% since 2023 across multiple 2026 benchmark reports. The median new-CAC ratio reached $2.00 per $1.00 of new ARR, up 14% year over year. Median CAC payback sits at 15 months for the broader population and 8.6 months for the elite cohort.
A budget built on 2022 CAC assumptions will underspend in 2026 by roughly half.
SaaS marketing budget allocation by channel (with 2026 benchmarks)
Line items shift dramatically by stage.
People (45–55% of total marketing spend)
This remains the largest line item across nearly every SaaS marketing budget. Gartner 2025 data shows 39% of CMOs planned to reduce labor costs. 22% said GenAI enabled them to reduce reliance on external agencies.
The companies absorbing the work with AI tools and senior generalists are growing faster per dollar spent than those who kept the same headcount. We have seen this shift in client work over the past 18 months.
Paid media and demand generation (20–30%)
Gartner 2025 puts paid media at 30.6% of total marketing budgets, up from roughly 28% the year before. For B2B SaaS the split typically includes Google Ads for competitor conquesting and brand defense plus LinkedIn for ABM.
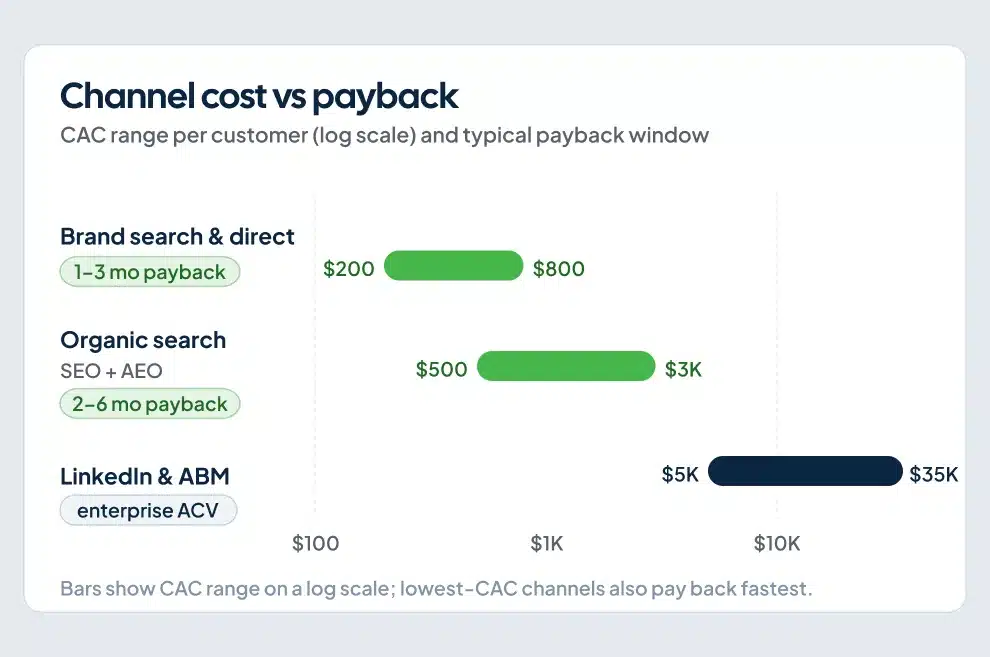
Brand search and direct traffic carry the lowest CAC, often $200–$800 per customer, with payback in 1–3 months. LinkedIn and ABM carry the highest CAC, $5,000–$35,000, but target enterprise accounts where ACV justifies it.
Content, SEO, and AEO (15–25%)
Organic search remains the highest-ROI long-run channel for most B2B SaaS, with break-even at 6–9 months and compounding returns after that. Organic search CAC ranges from $500–$3,000 per customer with 2–6 month payback.
A new 2026 category is AEO/GEO spend. 73% of B2B buyers now use AI tools in research. One independent study found organic traffic has only a 0.23 correlation with ChatGPT citations. A small SaaS can outperform a competitor with 125 times the traffic in AI citations.
For instance, our work with KleerCard moved their clicks up over 30%, impressions up over 250%, and started generating leads from AI Overviews all within two months. After 1 year, half of all new customers were through organic search. Their LTV:CAC ratio is 24:1.
This kind of result shows up when you treat AI search as a deliberate budget line.
Website and product marketing (8–12%)
Most SaaS companies underspend here and overspend on paid media to compensate. A high-converting website pays back faster than any paid channel because every other channel funnels into it. Conversion rate improvements compound on top of all upstream spend.
If a SaaS is spending $40K per month on paid acquisition and the website converts at 1.5%, doubling conversion to 3% is mathematically equivalent to doubling the paid budget. The website work usually costs a fraction as much. We build sites on Webflow for this reason.
Martech, events, customer marketing (10–15% combined)
Martech typically takes 4–6% of total marketing spend. Events take 3–5% at most SaaS companies, higher for enterprise targeting in-person meetings. Customer marketing, advocacy, and expansion programs remain underfunded at most growth-stage companies. NRR above 110% improves growth rate by 5 percentage points.
A worked example: building a SaaS marketing budget from scratch
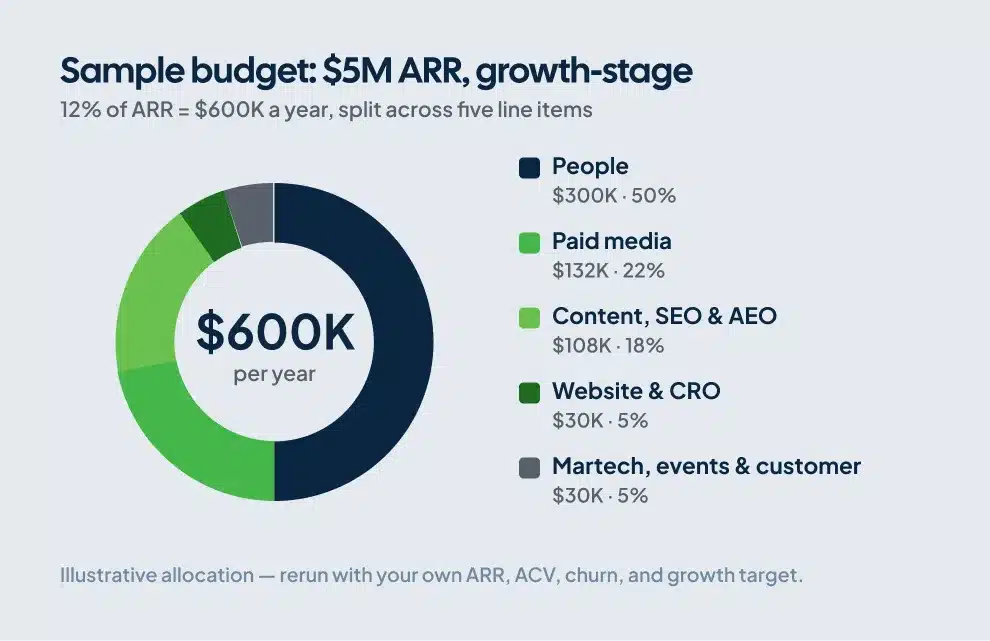
Company: $5M ARR B2B SaaS, growth-stage, bootstrapped, targeting 30% YoY growth.
Total marketing budget: 12% of ARR equals $600K annual or $50K monthly.
Allocation:
-
People (50%): $300K. Head of marketing, content writer, fractional designer, and contractor budget.
-
Paid media (22%): $132K. Google Ads for brand and competitor conquesting plus LinkedIn for ABM on key accounts.
-
Content, SEO, and AEO (18%): $108K. Blog production, technical SEO work, and AI search optimization.
-
Website and CRO (5%): $30K. Webflow site refresh plus ongoing conversion rate experiments.
-
Martech, events, customer marketing (5%): $30K.
What changes if they take a Series A and target 100% growth? The budget jumps to 25% of ARR, or $1.25M. Most of the increase lands in paid media and headcount.
This is an illustration, not a prescription. Run the same math with your own ARR, ACV, churn, and growth target. We have used this template with clients who later defended their budgets to boards.
How to defend the budget to a CEO, CFO, or board
Anchor on payback, not percentage
The 8% of ARR median is useful for sanity-checking. No CFO approves a budget because it matched a survey median. They approve based on payback period and Magic Number.
Show the CFO the marketing spend, the new ARR it is expected to generate, and the payback period under each scenario. Magic Number equals new ARR times 4 divided by previous quarter S&M spend. Target above 1.0 to prove capital efficiency.
Show three scenarios
Conservative: hold S&M flat as percent of ARR. Forecast growth at last year’s rate.
Base: increase S&M by 10–15%. Forecast growth at last year’s rate plus headroom from improving CAC.
Aggressive: 20–40% S&M increase. Forecast growth at venture-funded rates with explicit CAC assumptions.
What boards will push back on
-
Headcount additions ahead of revenue. Justify with payback math.
-
Brand spend with no attributable pipeline. Tie everything possible to pipeline metrics.
-
Agency spend. 39% of CMOs are cutting agency budgets in 2025. If you use an agency, the case must be specific.
Common mistakes when sizing a SaaS marketing budget
Copying the 8% median without context. It hides a 5x range across funding stages. A bootstrapped scale-up at 6% can outperform a Series B at 30% on net revenue retention. The right number depends on the variables the median ignores.
Treating sales and marketing as one budget. SaaS Capital tracks them separately at 13% selling and 8% marketing in 2025. When they are combined in planning, sales tends to absorb the marketing budget over time.
Underfunding the website. Most SaaS budgets allocate less than 5% to the conversion surface that every other channel funnels into. A 2x conversion rate improvement on the same paid budget pays back faster than any net-new acquisition channel.
Ignoring AEO/GEO. 73% of B2B buyers research in AI tools before reaching a website. If a SaaS is not being cited by ChatGPT, Perplexity, or Google AI Overviews for its category, that traffic is going somewhere else.
Setting the budget once a year. Many CMOs reported budgets may be cut mid-year due to economic volatility. Build a quarterly review cycle into the budget process.
SaaS marketing budget by company type
B2B SaaS vs B2C SaaS
B2B SaaS spends more on sales at a median 13% of ARR. B2C SaaS spends more on paid media as a percent of marketing.
Bootstrapped SaaS
Median 95% of ARR total spend, profitable. Marketing typically 5–10% of ARR. 85% of bootstrapped SaaS companies operate within 2 points of breakeven.
Equity-backed / venture-funded SaaS
Median 107% of ARR total spend, operating at a loss to fund growth. Marketing typically 10–25% of ARR. 55% of equity-backed companies are operating at a loss.
Product-led growth (PLG) SaaS
PLG SaaS spends 13% of revenue on marketing versus 9% for sales-led models.
For the broader SaaS marketing strategy that sits behind these numbers, see our guide on SaaS marketing strategies.
Frequently asked questions
What percentage of revenue should a SaaS company spend on marketing?
The median B2B SaaS company spends 8% of ARR on marketing, per SaaS Capital’s 2025 survey of over 1,000 private companies. Equity-backed SaaS companies spend approximately 58% more on marketing than bootstrapped peers. Early-stage SaaS often allocates 20–40% of revenue, while mature SaaS runs 5–15%.
How much should a SaaS startup spend on marketing in the first year?
Most early-stage SaaS startups (under $1M ARR) spend a fixed dollar figure rather than a percentage: roughly $1,000–$5,000 per month for bootstrapped startups and $5,000–$15,000 per month for funded ones. Founder-led marketing carries most of the load. Paid spend is rarely the highest-ROI move at this stage.
What is a reasonable SaaS marketing budget?
A reasonable B2B SaaS marketing budget falls between 5% and 25% of ARR, depending on growth stage and funding. Companies targeting 30% YoY growth typically land between 10% and 15% of ARR. Companies targeting 100%+ growth commonly run 20–40% of ARR or higher.
How do you calculate a SaaS marketing budget?
Three methods are common: percentage of revenue anchored to industry medians, bottom-up channel build that prices each channel at expected CAC and target customer count, or CAC-driven back-solve from target LTV:CAC ratio and customer acquisition target. Most well-run SaaS companies use a combination.
Can a SaaS grow with a $0 marketing budget?
Yes, in narrow circumstances. Founder-led content, community engagement on Reddit, Indie Hackers, and niche forums, and referrals from existing users have built early-stage SaaS companies to $10K MRR and beyond without paid acquisition. Beyond roughly $1M ARR, $0 marketing budgets become a growth ceiling.
What’s the biggest line item in a SaaS marketing budget?
People. In-house team plus contractors typically account for 45–55% of total marketing spend.
Summary
Anchor on percentage of revenue between 5% and 25% depending on stage. Back-solve with CAC and payback math. Allocate by stage-appropriate channel mix. Defend with payback period, not survey medians.
If you are building this in-house and your team has the bandwidth, the framework above is enough to size and defend a budget. If you are sizing the SEO and AEO portion specifically and want the same approach we used to build KleerCard’s organic and AI search visibility from zero, ClearBrand’s SaaS SEO services deliver exactly that system.